
With the tsunami of information that hits us every day, infographics – simple picture “stories,” which are quick and easy to understand – become lifesavers. They help us organize, collate and curate the information that pours at us from screens in a torrent.
The WHY
If you are in an industry that needs to present data in an effective manner to communicate and engage customers and prospects, then infographics are what you need.
Statistics support the value of pictures that paint 1,000 words
- Only 20 percent of text is remembered.
- 90 percent of the information transmitted to our brains is visual
- Color images increase our willingness to read by 80 percent
- Infographics are 30 times more likely to be read than a text article
- 45 percent of marketers currently use infographics (up 12 percent in two years)
9 reasons to use infographics
- They’re compelling
People love facts, figures and statistics. Add great images, graphics, colors and design and you now have “addictive content.”
- They’re easily digested
Since we humans are highly visual, 90 percent of the information we actually absorb is visual. That’s 90 percent worth tapping into!
- They’re easy to share
Because of the attractiveness of a good infographic and the simple synopsis of information they translate, they have a much higher probability of being shared as compared to the same basic information in traditional text format.
- They’re portable (embeddable)
When you design, develop and publish an infographic, the code to put it on a WordPress blog or website is provided as an embed code. This creates an automatic link for posting and connects anyone who clicks the infographic anywhere that it is posted to your site.
- They give you instant worldwide coverage
At the push of a button, online publishing makes your infographic visible globally in an instant. Local print media coverage could never do that.
- They support brand awareness
An infographic typically includes your logo and represents your brand. It is an excellent way of sharing and creating greater brand awareness.
- They increase traffic
An infographic that compelling by nature will drive traffic to your website as people click and share.
- They benefit Search Engine Optimization (SEO)
The more people click on the infographics and link to your site, the higher Google will index your website in the search list due to Google’s search “Page Rank” algorithm. This in turn increases the importance that search engines place on your site.
- They help you show expertise on a subject
The research required to create a successful infographic will display your knowledge and position you as an expert on your category or topic.
The WHAT
An infographic is a combination of illustration, design, writing and analysis. They are visually compelling, simple and when done well, can communicate complex data or ideas in a visual format that can easily be shared. An infographic is an efficient way of combining the best images, text and design to represent complex data that tells a story that begs to be shared.
8 of the most common types of infographics:
1. Visual Article – a long piece of writing made more visual

https://commons.wikimedia.org/wiki/File:PDAF_4.png
2. Flow Chart – answers a specific question by giving readers choices

https://www.pinterest.com/mickysingt/inspiration/
3. Timeline – tells a story through the use of chronological data

https://commons.wikimedia.org/wiki/File:Time_Travel_Method-2.svg
4. List – supports a claim or view through steps, rules or reason

https://www.flickr.com/photos/gdsdigital/4362450802
5. Number Love – lots and lots of charts, graphs and stats
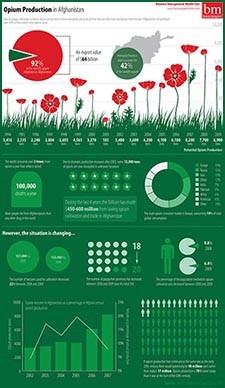
https://www.flickr.com/photos/gdsdigital/4398097293
6. Versus Comparison – studies two things in a head-to-head comparison
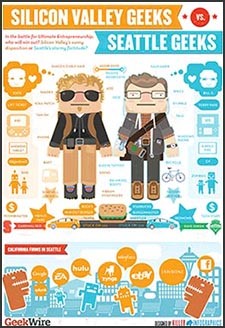
http://www.geekwire.com/2012/seattle-silicon-valley-infographic-quantifies-differences/
7. Data Viz – pulls lots of complex data into a clean, unique design
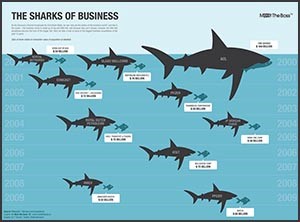
https://www.flickr.com/photos/gdsdigital/4875139826
8. Map – shows cultural/behavioral/other trends by location
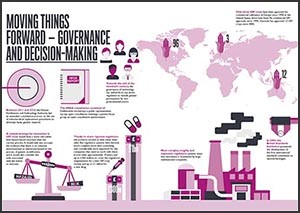
https://www.flickr.com/photos/go-science/16807670676
The HOW
The greatest challenge is creating the infographic. To get you started,
here are six basic “rules” for creating a successful infographic:
- Use a three-color palette with contrast
- Choose similar type styles and proportions
- Develop an easy-to-follow logical flow
- Keep text clean and legible
- Use negative space to create balance
- Always cite your sources
Here are five resources to help you some more:
- Adobe Color – For your color palette creation
- Google Fonts – for mastering your type
- Piktochart – for inspiration and templates
- Creative Market – For icons, resources and more
- Slideshare – For smarter distribution and sharing
Or, better yet, contact LRG Marketing Communications to see what special, successful infographic we can create to help promote your business and brand!
Sources:
B2C Content Marketing 2015
Benchmarks, Budgets and Trends, CMT Google Trends
Why do Infographics Make Great Marketing Tools, Unbounce.com
New Infographic Reveals the Value of Infographics, Adweek.com/PRNews
9 Awesome Reasons to Use Infographics in your Content Marketing, Jeff Bullas.com